
S&K analysis calculates the relative distances between statements or concepts measured by paired comparisons. PAL stats has adapted a technique using the least-squares solution to the method of paired comparisons. The analysis allows for scaling statements/variables from their paired comparisons to be converted into a rank, based on their importance or other preference data. The real advantage that the technique offers lies in the possibility of returning a single ranking with less than half the possible pairwise preferences completed, provided there is reasonable consistency in the data. The consistency is measured by R2 and assessed by the statistician.
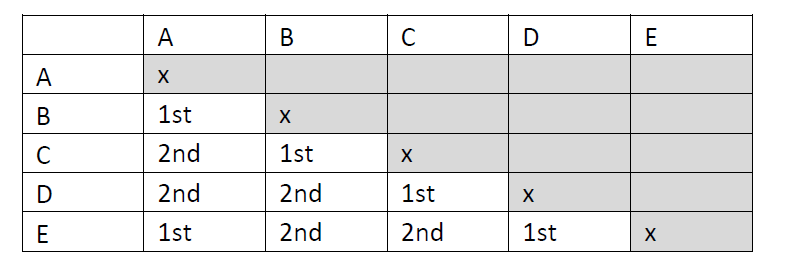
The requirement for the study is a linked design. Assuming that five profiles are assessed, instead of ten paired comparisons, only five comparisons are needed, as shown below:
- A vs B
- B vs C
- C vs D
- D vs E
- E vs A
To obtain the full coverage of pairs two versions of a study (rotations) are needed, with a 2nd group comparing the following pairs:
- A vs C
- C vs E
- E vs B
- B vs D
- D vs A
Measurement and questionnaire design for S&K analysis
There are two ways we can ask the measurement questions in a survey questionnaire…
Option 1
Question: Here are two attributes of the website, which is more important when using the portal?
- Attribute A
- Attribute B
- The same
- Neither is important
- Don’t know
Was that an easy or difficult Choice?
- Easy choice
- Difficult choice
The weakness of this arrangement is that it makes it easy for the respondent to avoid deciding between the attributes (using “the same” option), thus making the answer irrelevant. Also, it encourages flatlining, and so no relative importance to the respondent would be detected.
Option 2
Question: Here are two attributes of the website, please choose one attribute over the other where:
- “5 is significantly more important.”
- “4 is more important.”
- “3 is slightly more important.”
- “2 is slightly less important.”
- “1 is less important.”
- “0 is significantly less important.”
| Attribute A | 5:0 | 4:1 | 3:2 | 2:3 | 1:4 | 0:5 | Attribute B |
This method forces respondents to make a choice, but it may cause them a concern when two statements are equally important to them. The question is whether this task is realistic with the given attributes.
We can use either of these two methods.
To set up a survey using S&K analysis, PAL stats will need to create the design. An odd number of statements is preferable as, linkage, balance and coverage is more simple to create. We do not recommend using an even number of statements. There is one design for three questions and an additional design for each extra pair of matrices. We recommend 9, 11, 13 or 15 attributes, but the list of measures can increase, but please consider respondent fatigue with larger numbers. Please note that the number of pair comparisons will be one more than the number of statements and the number of rotations is the number of variables minus one divided by two. We can use, as a minimum, 2 cases per rotation but within the rotation. In quantitative studies, we show pairs in random order with the data output unrotated in the order of the design to avoid order bias. The order of the statements in each paired comparison ought to have rotations again. The outputted data will be unrotated in the order of the design.
S&K analysis has many benefits:
- It can be used with very small sample sizes, such as qualitative discussion groups, as we are only testing the internal consistency of the respondent’s answers and then calculating the relative ranks they give,
- We can use it to test the reliability of respondents in a sample allowing market researchers and panel companies to eliminate unengaged respondents or those giving inconsistent answers.
- We are planning to use this method in conjoint analysis – using concept cards. We will provide more details on this once we have completed development.
- This method is most frequently used to work out the respondent’s relative importance of statements or concept cards in quantitative studies.
Please contact us if you are interested in using S&K analysis in your projects.