
Correspondence Analysis is a reduction technique which uses a contingency table composed of rows and column counts in reduced dimensionality.
It is mainly used to provide a summary map of the rows and columns to show how they relate to each other. The rows and columns of the table are often objects (e.g. brands) and their attributes. The table contains a count of the number of times a brand is perceived to possess each attribute.
Most applications of Correspondence Analysis treat the raw data in the table to remove row and column effects before producing the map. In this case, the cells of the table, which starts-out as raw counts, are adjusted by a chi2 transformation. The chi2 calculation firstly calculates the Expected value in each cell, from the product of the row and column margins, divided by the total (r*c/t). Then the expected value is subtracted from the raw data to show the deviations from expectation. When this applies, maps show the Relative effects of rows and columns; the absolute values modified.
A simple example of the row and column adjustment follows
| Raw | |||
| Totals | 10 | 20 | 30 |
| 10 | 2 | 4 | 4 |
| 20 | 3 | 8 | 9 |
| 30 | 5 | 8 | 17 |
| Adjusted | |||
| Totals | 0 | 0 | 0 |
| 0 | 0.33 | 0.67 | -1 |
| 0 | -0.33 | 1.33 | -1 |
| 0 | 0.0 | -2 | 2 |
(example – cell(3,3), raw value = 17, expected = 30*30/60 = 15, deviation = 17-15 =2)
It is possible to override the adjustment for relative mapping, but most applications in Market Research use relative mapping because it is deemed to overcome the, so-called Halo Effect of big brands which would normally pick up a large endorsement across many attributes, simply due to their size. Smaller brands tend to be endorsed less widely. Sufficient knowledge of any specific brand should always be a condition of response and accounts for this in the marginal totals.
Researchers often describe relative maps as showing the “Character” of brands. If maps use absolute values, they show the strength (in the market) of brands.
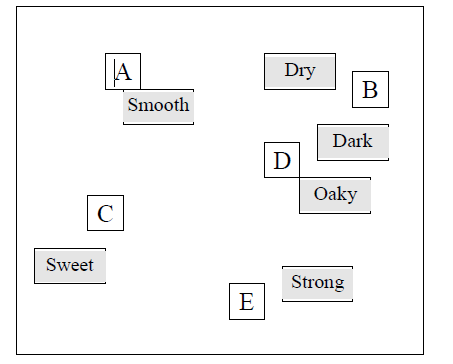
A typical map shows brands and attributes as coordinates in two dimensions, thus
Please contact us if you would like us to run correspondence analysis on your data.

Thanks for your blog, nice to read. Do not stop.